What's new

CoasterForce's favourite coasters 2018

Pokemaniac

Mountain monkey
Staff member
Administrator
Moderator
2018 is over, and so is its coaster season. The end of the year is an excellent occasion to find out which coasters have been thrilling our members the most, not only in 2018, but across all previous years as well. It is time to declare CoasterForce's favourite coasters as of 2018! To do so, we have collected your votes for the best coasters out there, at least the best you have ridden. Our eminent statistician @Hyde has churned the data, and now we can present the best-liked coasters of the CF community!

Thanks for having voted, everybody!

... "But wait," I hear you say. "Where was this poll put up? Where could I vote? What did I miss?". Fret not, dear CF-er, we have you covered. One of the staples of the CF forums is the "Top 10-ish" thread, where users continuously post their updated Top 10 list of favourite coasters. Or top 20, or 40, or elaborate spreadsheets ranking the ride experience of every coaster they have ridden, using a myriad of parameters. Or in one memorable case, ranking their top one coaster plus some honourable mentions. Chances are high that you've posted there yourself.

We have combed through the entire thread for top 10 lists posted between October 31, 2017 and October 31, 2018. The most recent list from each user was collected in a spreadsheet. In total, 59 members unwittingly cast their vote for this ranking, naming 138 different coasters across their top ten lists. Lists featuring fewer than 10 coasters were also counted; there were only a couple of those. Some lists featured (way) more than 10 coasters, in those cases only the top 10 were counted.

How we did the Math: TLDR
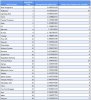
We tabulated each top roller coaster signature ranking, breaking out each roller coaster as ranked by each member of the community. We then divided each roller coaster's average ranking by the number of times it was ridden by members. The number you see next to each roller coaster is this final calculation: the lower a number, the more higher rated it was amongst all members.

The resulting top 25:
# - Coaster name
, Park (Manufacturer, opening year) - Score
1 - Steel Vengeance, Cedar Point (RMC, 2018) - 0,06
2 - Lightning Rod, Dollywood (RMC, 2016) - 0,14
3 - Taron, Phantasialand (Intamin, 2016) - 0,18
4 - Maverick, Cedar Point (Intamin, 2007) - 0,25
5 - Twisted Colossus, Six Flags Magic Mountain (RMC, 2015) - 0,25
6 - Skyrush, Hersheypark (Intamin, 2012) - 0,25
7 - Helix, Liseberg (Mack, 2014) - 0,27
8 - Voyage, Holiday World (PTC, 2006) - 0,29
9 - X2, Six Flags Magic Mountain (Arrow, 2002)- 0,29
10 - El Toro, Six Flags Great Adventure (Intamin, 2006) - 0,31
11 - Fury 325, Carowinds (B&M, 2015) - 0,37
12 - Outlaw Run, Silver Dollar City (RMC, 2013) - 0,38
13 - Nemesis, Alton Towers (B&M, 1994) - 0,42
14 - Shambhala, Port Aventura (B&M, 2012) - 0,43
15 - Storm Chaser, Kentucky Kingdom (RMC, 2016) - 0,48
16 - Millennium Force, Cedar Point (Intamin, 2000) - 0,51
17 - Wicked Cyclone, Six Flags New England (RMC, 2015) - 0,55
18 - Expedition GeForce, Holiday Park (Intamin, 2001) - 0,56
19 - Schwur des Kärnan, Hansa Park (Gerstlauer, 2015) - 0,58
20 - Boulder Dash, Lake Compounce (CCI, 2000) - 0,58
21 - Wildfire, Kolmården (RMC, 2016) - 0,59
22 - Twisted Timbers, Kings Dominion (RMC, 2018) - 0,78
23 - Top Thrill Dragster, Cedar Point (Intamin, 2003) - 0,80
24 - Montu, Busch Gardens Tampa (B&M, 1996) - 0,80
25 - Intimidator 305, Kings Dominion (Intamin, 2010) - 0,81

As you may see, the list is somewhat heavily slanted towards the bigger parks in the US. This is partly because they tend to draw more visitors, which means a greater number of CF-ers will visit them, and partly because they tend to build bigger coasters. Cedar Point, which markets itself as "the roller coaster capital of the world" has four coasters in the top 25, including the champion by a vast margin, Steel Vengeance. Note that everybody who have ridden Steel Vengeance would also be likely to have ridden all the other coasters in that park, and so would be prone to putting some of them in their top 10 list.

The list is also heavily favouring new coasters, which presumably is a sign that manufacturers keep improving as time goes on. A major point to note is that a vast majority of the coasters featured in the top 25 are the newest coasters built at their respective parks, ranking over previously built coasters in chronological order. There are some notable exceptions, most prominently Montu and Nemesis, which both rank among the oldest operating coasters in their parks, with none of their younger "co-workers" to be seen on the list. Interestingly, those are also among the oldest inverted coasters B&M has built.

On the manufacturer side, it is notable that almost two thirds of the coasters in the top 25 list are built by the same two manufacturers. Rocky Mountain Construction of Idaho, USA and Intamin Amusement Rides of Schaan, Liechtenstein both have eight entries in the list. It seems like their aggressive coaster designs resonate particularly with the preferences of CF members. Bolliger and Mabillard of Monthey, Switzerland has four coasters among the top 25, the final five spots are claimed by one manufacturer each.

Do these results look disagreeable to you? Do you think that an extra opinion could have shifted the rankings? We discovered to our surprise that not all the active CF members had posted a top 10 list in the last year. If we all chime in in the thread in 2019, will next year's list be any different? And what difference will all the amazing new-for-2019 coasters bring? Go over to the Top 10-ish thread, list your ten(-ish) favourite coasters, and help us find out next year!


Thanks to @Hyde, @Hixee, and @Ian for input and help to create the rankings!
 

Pokemaniac

Mountain monkey
Staff member
Administrator
Moderator
This post was entirely authored by @Hyde, but for the sake of simple coordination, I post it here;

How we did the Math: TLDR
We tabulated each top 10 signature ranking, breaking out each roller coaster as ranked by each member of the community. We then divided each roller coaster's average ranking by the number of times it was ridden by members. The number you see next to each roller coaster is this final calculation: the lower a number, the more higher rated it was amongst all members.

How we did the Math: Full Read
Calculating rankings of roller coasters can be a tricky business. On one hand, you can do a straight run of how many times rides were ranked #1, #2, #3, etc. If we did this, our Top 10 rating would look like this:

1. Eejanaika - 1.00
2. Gold Striker - 1.00
3. Railblazer - 1.00
4. Steel Vengeance - 1.35
5. Lightning Rod - 2.41
6. Taron - 3.00
7. Formula Rossa - 3.00
8. Lech Coaster - 3.00
9. T Express - 3.00
10. The Big One - 3.00

Pretty different, huh? But, let's consider how many times each of these roller coasters was ridden:

1. Eejanaika - 1 rider
2. Gold Striker - 1 rider
3. Railblazer - 1 rider
4. Steel Vengeance - 23 riders
5. Lightning Rod - 17 riders
6. Taron - 17 riders
7. Formula Rossa - 2 riders
8. Lech Coaster - 1 rider
9. T Express - 1 rider
10. The Big One - 1 rider

Well that's not very fair, as 7/10 rides had one or two riders, making the top 10 rankings very dependent on how high each roller coaster was highly ranked, versus number of times each roller coaster was highly ranked.

Many other amusement park polls have run into this in the past. The famed Mitch Hawker Roller Coaster poll used to eject roller coasters that had low ridership numbers. So, for our rankings, we offered a control of dividing the average rating of each ride by the number of times it was ridden. This way, strong outlying roller coasters that get ranked very high or very low by one or two members do not as heavily influence the rankings. In this way, our top 10 rankings are reflective of those roller coasters that were ridden the most, and also agreed to be very good rides.

To show this a little further past our top 10 ratings, I'll give you two graphs to show how the numbers play out.

First, here's a bar chart with two things going on: average ranking of each roller coaster (bars in blue) and number of times each roller coaster was ridden (bars in red). As you can see, ranking our roller coasters as a division of average ranking by number of times ridden pencils out pretty well: highest ridden and rated roller coasters place towards the top, as lesser rated or ridden roller coasters round out the bottom. Also notice the yellow trend line I added to get a sense of how roller coasters were ridden - the curve works out almost perfectly for rounding out rides per roller coaster across our rankings.

Lz1xz6p.png


Obviously, our rankings are really geared towards favoring highly rated and highly ridden roller coasters. If we were to plot this out another way (using ranking as X and number of rides as Y), we would assume our top roller coasters to fall somewhere along the red line charted below.

55UbCRe.png


... And they do! At least, the beginning half of the top 10 clustering do. Maverick, Skyrush, El Toro, Voyage, X2, which round out the later half of our top 10, can be seen in another interesting trend; their average rankings blend closer to the rest of roller coasters, but have been ridden far more, hence placing higher on our ranking. It's interesting to see how busy it gets from #15 on; this reflects roller coasters having nearly equal amounts of rides, with wider varying opinion on their ranking.

You can see the full rankings, data, and tabulations in our shared Google Sheet Here:
If you're interested in learning more on roller coaster rankings and calculations, there's a lot of good reads out there, especially in the old Mitch Hawker Poll on differences between Golden Ticket and Other Polling and Different Polling Methodology.
 
Last edited by a moderator:

Pokemaniac

Mountain monkey
Staff member
Administrator
Moderator
I absolutely love this! Thank you very much for compiling this data @Pokemaniac and @Hyde! Will this become an annual thing, or is it just for 2018?
We'll see! Data is at least generated continuously as long as people post in the top 10-ish thread, and we've got a usable methodology sorted out now. Also, I guess nobody will notice next time if we just re-use most of this year's OP apart from the lists themselves, so I think it would be easy enough to do it over again next- ... err, this year. All it takes now is just to do it. Apart from the communication between the people involved, the only time-consuming task is setting up the spreadsheet, which took an afternoon this time. Maybe for 2019, we can even meet the goal of getting it all posted before Christmas, as the data is collected in early November after all.
 

Matt N

CF Legend
We'll see! Data is at least generated continuously as long as people post in the top 10-ish thread, and we've got a usable methodology sorted out now. Also, I guess nobody will notice next time if we just re-use most of this year's OP apart from the lists themselves, so I think it would be easy enough to do it over again next- ... err, this year. All it takes now is just to do it. Apart from the communication between the people involved, the only time-consuming task is setting up the spreadsheet, which took an afternoon this time. Maybe for 2019, we can even meet the goal of getting it all posted before Christmas, as the data is collected in early November after all.
Great stuff! Thanks for the clarification @Pokemaniac!
 

JoshC.

Strata Poster
Awesome and really interesting stuff; thanks to everyone involved!

Rather amusingly, I've been meaning to post my updated Top 10 in the thread, but had been working on some geeky stats stuff after taking inspiration from Hyde. Hopefully I'll get round to it over the next week...

(So yeah, if you ever need an extra pair of mathematical hands, give me a shout... ; ) )
 

Pokemaniac

Mountain monkey
Staff member
Administrator
Moderator
Too much spare time over the Xmas holidays anyone? ;)
If only... If that were the case, you'd have seen this on December 21. I was too busy eating gingerbread and chocolate while watching classic cartoons to get this done before now.

Also, a big thanks to everyone who contributed! Make sure to visit the Top 10-ish thread and post your lists before the end of October, so it will count towards any new rankings! You may notice that I forgot to post mine (although the one I posted in July 2017 is still current), so it wasn't counted. I would also have liked to see the Top 10 lists of other well-traveled members on here, like Ben, Ian, ECG or Gavin. This project won't be quite so secret next time, so I'll make sure to post some reminders for people to submit their lists.

Lastly, if anybody else have any other good ideas on how to sort the rankings, feel free to copy the data from the spreadsheet and play around with it!
 

Antinos

Slut for Spinners
This is so ****ing awesome. I love that you guys took the time to run through all those posts and run some analysis on the data. Your methodology looks like it's quite sound for what you're trying to convey. Obviously one could interpret the data any logical way they wanted, but this looks great! I am honestly not surprised in the slightest in the rankings except for one notable exception: Superman - The Ride at Six Flags New England. Back in the day, it was THE coaster, but times have obviously changed. Regardless, I can understand why each ride ended up where it did based on the the popularity or hype surrounding each on the forums.

Excellent work! I can't wait to see this list evolve over time.


EDIT: Some low hanging fruit that could potentially be added in the coming weeks (or just save it for next year) would be to break out the data in various ways, like by continent or steel/wood.
 

Hyde

Matt SR
Staff member
Moderator
Social Media Team
EDIT: Some low hanging fruit that could potentially be added in the coming weeks (or just save it for next year) would be to break out the data in various ways, like by continent or steel/wood.
@Hixee and I were talking about doing this using some of the data he has plotted out for League of Goons. I also wanted to be sure the dataset was shared for anyone else interested to play around. :)
 

Howie

Donkey in a hat
Or in one memorable case, ranking their top one coaster plus some honourable mentions!

Hey - that was me! Not the first time I've been referred to as a 'memorable case' to be fair :D
So, in this instance, does a single vote for SteVe and nothing else give SteVe an unfair advantage? Kinda feels like it's gained an 'extra' vote, ya get me?
Bit gutted that my updated list, which was posted after the date window for this poll, won't count, but I'll know for next year.

As others have mentioned - this is a fab thread, thanks to Poke, Hyde, Hixee and The Chief for putting it together. :)
 

Pokemaniac

Mountain monkey
Staff member
Administrator
Moderator
So, in this instance, does a single vote for SteVe and nothing else give SteVe an unfair advantage? Kinda feels like it's gained an 'extra' vote, ya get me?
Even without that vote, it was ranked as #1 by 17 users, while Taron in second place had 6 top votes. I don't think your vote made any difference there.

It is also very interesting to see how Lightning Rod got the top spot in so few lists, but took second place a whooping 14 times. In only one of those cases, it was ranked above Steel Vengeance, but it also took second place behind coasters such as Skyrush, Expedition GeForce, Voyage or Eejanaika. There seems to be a remarkable consensus on placing Lightning Rod as one's second favourite coaster, but it's less clear which coaster goes ahead of it.
 

VikingsAf

Mega Poster
Hmmm. It's a good effort in making a ranking, and looking at the result I think it's okay close to realism on this forum. But my remarks.
- I put a top 10, doesnt mean I didn't ride more than 10 coasters. You have 17 riders on X and 25 riders on Y now because it's in their top 10. But maybe X has 15 more riders that rate it far below top 10, while Y doesn't. This would lower X drastically.
- Rides with many riders are indeed heavily favoured, but you confirm that. Alltough the top few have similar ridership do thats fine I suppose. Maybe this formulla is closer to taking this into account: avg_rank/ln(ridership+1) (basic formulla reducing influence of ridership when ridership is much higher)
 

Hyde

Matt SR
Staff member
Moderator
Social Media Team
Gonna go old school UC with a string of responses to some great observations here
So, in this instance, does a single vote for SteVe and nothing else give SteVe an unfair advantage? Kinda feels like it's gained an 'extra' vote, ya get me?
Partly yes - number of times a roller coaster is ridden helps score the most, since we are using number of times ridden as our denominator.

Like I mentioned for the second chart I threw out, you can see a secondary trend form in the middle of the table - a clustering of roller coasters that have nearly identical ridership, but varying opinion on ranking. For these roller coasters, how one is ranked would be more influential than number of riders.

55UbCRe.png

- I put a top 10, doesnt mean I didn't ride more than 10 coasters. You have 17 riders on X and 25 riders on Y now because it's in their top 10. But maybe X has 15 more riders that rate it far below top 10, while Y doesn't. This would lower X drastically.
This is definitely a risk when cutting off ballots at 10 entries. Extending the ballot to 25 or 30 roller coasters could help better define rankings, versus the pretty tight clustering they currently are. There is some risk however to larger ballots; Mitch Hawker did a pairwise comparison (and added some bonus for more ridden users), which meant ballots with larger numbers of roller coasters would exert more power in the tabulation and skew results towards fewer, more-ridden ballots. There was one year Intamin Megalites specifically scored very high, despite having vastly less riders.

Ultimately, we saw the top 10 in folks sigs as the largest, easiest capture of data, and felt that a best, first stab at running numbers.

- Rides with many riders are indeed heavily favoured, but you confirm that. Alltough the top few have similar ridership do thats fine I suppose. Maybe this formulla is closer to taking this into account: avg_rank/ln(ridership+1) (basic formulla reducing influence of ridership when ridership is much higher)
This is a good suggestion that we should incorporate going forward. I hadn't really thought natural log would be needed as we have a relatively small set of data. For those wondering why natural log would be good to use; it is often helpful for determining regression and correlation, but limiting the effect of large outliers, such as highly ranked, little ridden roller coasters.

EDIT - SCROLL TO NEXT POST FOR UPDATED RANKINGS
I did rerun the numbers however using natural log, and found the rankings surprisingly don't change too much. A few roller coasters gain tons of ground (Railblazer jumps to #2 and Formula Rossa to #18), which I would imagine are those with fewer riders, who still ranked coasters very high. Majority of the rest though move 0-1 spots, which means counting only frequency still captures a good deal of the trend.

I will still add in the log calculation to the dataset we shared in @Pokemaniac's original post, just to show how the rankings would play out when calculated as such. :)
 

Attachments

  • Screen Shot 2019-01-02 at 4.59.25 PM.jpg
    Screen Shot 2019-01-02 at 4.59.25 PM.jpg
    104.5 KB · Views: 61

Pokemaniac

Mountain monkey
Staff member
Administrator
Moderator
I did rerun the numbers however using natural log, and found the rankings surprisingly don't change too much; a few roller coasters gain tons of ground (Railblazer jumps to #2 and Formula Rossa to #18), which I would imagine are those with fewer riders, who still ranked coasters very high. Majority of the rest though move 0-1 spots, which means counting only frequency still captures a good deal of the trend.
The bolded bit suggests this formula is far from ideal too. Railblazer is only mentioned once in all the data, albeit with a top spot. But if one single top mention is enough to nab the second spot, the methodology ought to be tweaked.

Also, despite the downsides of using only people's top 10, the biggest advantage was that we had a lot of readily available data. If we had only used Top 20 lists, we'd have a tenth as many entries in the thread, and if we asked people to submit full ballots, few would bother to list it all. As such, this ranking really only ranks which coasters people have listed among their favourites the most often, and how highly they are ranked. If a hundred people had signed up to list Steel Vengeance as their 144th favourite coaster, the ranking would have told another story entirely. As it stands, it only reflects the coasters in their most positive light, but the amount of data is still enough to give a comparison in that regard.
 

Hyde

Matt SR
Staff member
Moderator
Social Media Team
And I also realized going back through data that somehow ridership numbers copied incorrectly. The real ranking lists below:

Screen Shot 2019-01-03 at 9.41.05 AM.jpg
... And in the process of taking natural log, all coasters with 1 rider get disqualified as you cannot calculate the ln of 1. So, shifts in ranking are actually even less, with the top 4 remaining constant.
 

Hixee

Flojector
Staff member
Administrator
Moderator
Social Media Team
... And in the process of taking natural log, all coasters with 1 rider get disqualified as you cannot calculate the ln of 1. So, shifts in ranking are actually even less, with the top 4 remaining constant.
You cannot divide by Ln(1).

[/pedant] :p
 
Last edited:

Howie

Donkey in a hat
Of course, the next logical question to ask is; how many of Coasterforce's Top 25 Coasters have you been on?
Who here has ridden all 25?
I'm on 17, which isn't bad I guess but there's some glaring omissions that bug me. L' Rod, Skyrush, Fury and B' Dash to name 4 that I really need to get on.
 
Top